Graph of the machine axes window
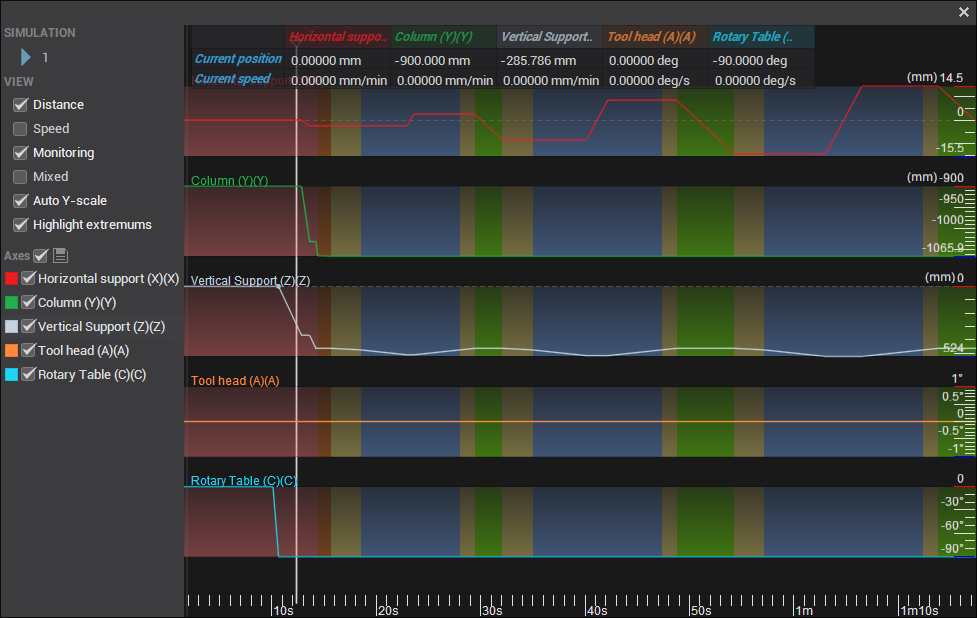
This feature allows you to view the change in the values of the machine axes over time as the tool travels along the path for the current operation, displayed as a set of graphs. To generate a graph, select the calculated operation from the list of operations, and click the corresponding button  on the main toolbar.
The window has the following layout:
SIMULATION:
Simulation. Starts tool and machine axis motion synchronously in the main graphics window and on the graph. A moving marker indicates the current time. Left-click the graph to place the marker at any point in time.
Change the simulation speed by scrolling the mouse wheel over the speed field or entering a value in the field  .
VIEW:
Graph types:
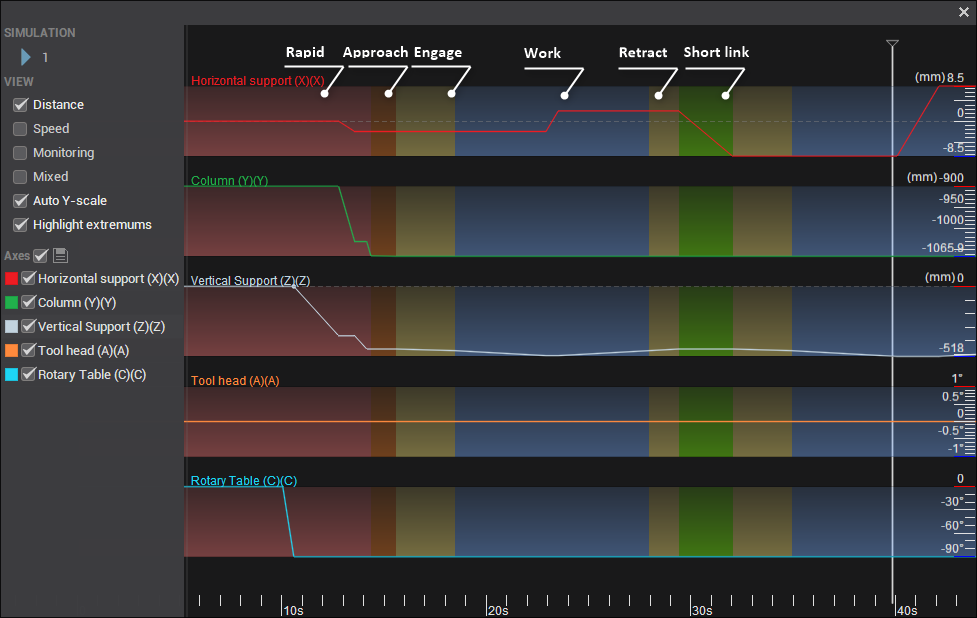
Distance. Shows the position of each machine axis as the tool moves along the toolpath. Linear axis positions are expressed in millimeters or inches; rotary axis positions are expressed in degrees.
Speed. Shows the first derivative of axis position with respect to time: the rate at which the axis coordinate changes. This is linear speed for linear axes and angular speed for rotary axes.
Material removal rate. Shows how the rate of material removal changes over time. The volume removed during each calculation interval is divided by the duration of that interval. The graph allows tool load to be compared along different sections of the toolpath. Selecting this graph displays its calculation settings and controls.
Display:
Monitoring. Displays a table at the top of the window with the current position and speed of each visible axis. Linear axis positions use the machine's length units, typically millimeters or inches, and linear speeds are shown in mm/min or in/min. Rotary axis positions use the machine's angular units, typically degrees, and rotary speeds are shown in deg/s. The values update as the time marker moves.
Mixed. Displays all selected axes on a single graph. When disabled, the axis graphs are displayed separately.
Auto Y-scale. Automatically adjusts the vertical scale to the minimum and maximum graph values. When the axes are displayed separately, this allows each axis graph to fill the same height. Rotate the mouse wheel with the pointer over the graphics area to change the horizontal scale.
Highlight extremums. Marks points where the direction of change of an axis coordinate reverses. This option is available only for the Distance graph. It is unavailable for Speed and Material removal rate.
Axes. Allows individual axes to be hidden and their colors to be changed by clicking the colored square.
The background color beneath the axis graphs indicates the feed type: working, rapid, approach, return, and so on.
Material removal rate calculation:
Tool load threshold. Sets a threshold for the material removal rate. Graph sections with high tool load are highlighted relative to this threshold. Enter a value and press Enter to apply it. The threshold can also be adjusted by dragging its line on the graph.
Calculation step. Sets the maximum step along the toolpath when calculating the graph. Click Recalculate graph to apply a new step to the graph.
High model resolution. Uses a high-resolution simulation model for the calculation. When disabled, the resolution specified in the simulation settings is used. Recalculate the graph after changing this option.
Recalculate graph. Starts calculation using the specified step and model resolution. The previous graph data is cleared at the start of the calculation.
Break process. Replaces Recalculate graph while a calculation is running and stops the calculation when clicked.